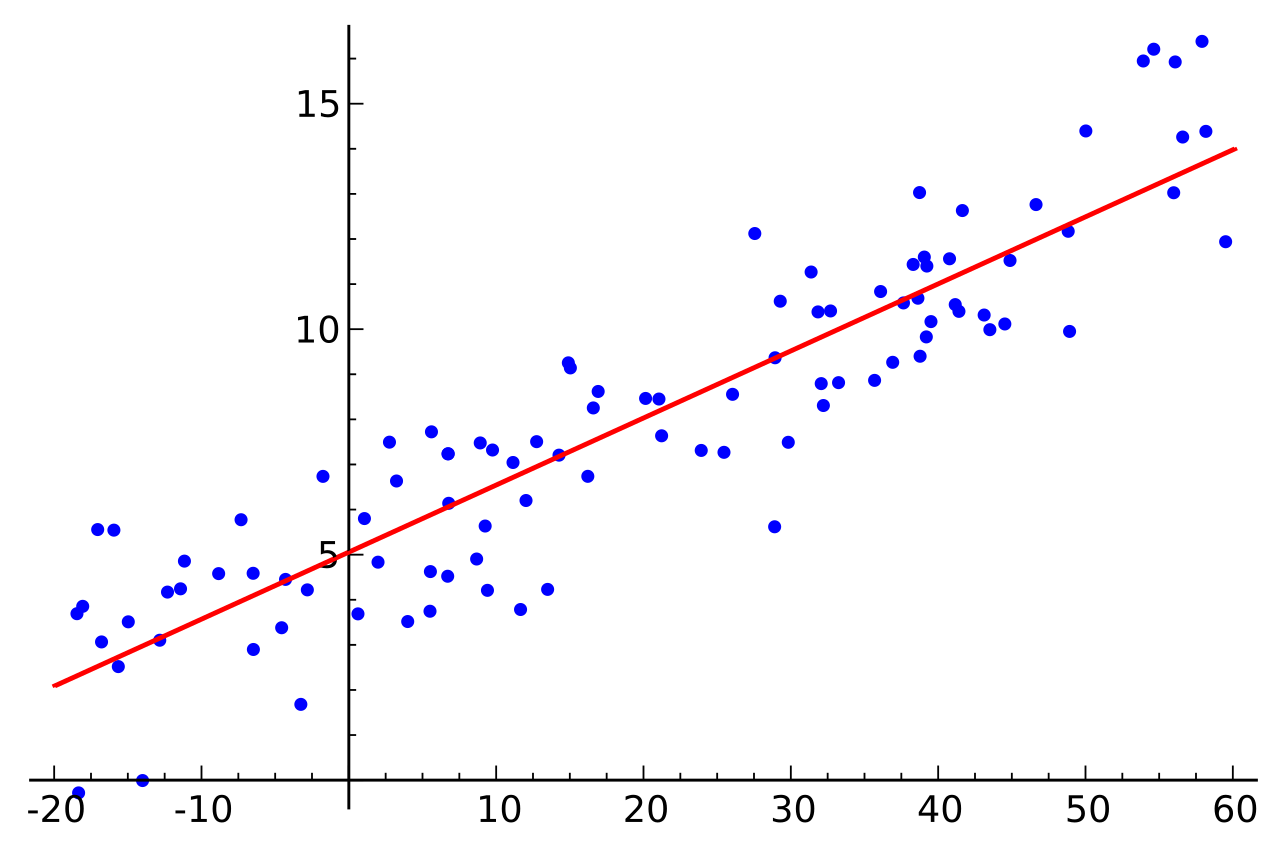
One of the simplest supervised machine learning tools used in data science, linear regression permits to find the best-fitting line that correlates data points in a two-dimensional space. Defining this line then enables the prediction of where other data points could be located in the space, if they have the same characteristics as the original data set or if they stand out of it.
To go into the details of linear regression and to program it in Python, this complete series of tutorials by Harrison Kinsley, a.k.a. Sentdex, dives in all the details of linear regression, programming tricks and present example uses of linear regression.
The following videos regroup the Linear Regression tutorials from the Machine Learning with Python series (parts 2 to 12) by Sentdex on Youtube. The final code can also be obtained from Sentdex Python Programming website, in the corresponding linear regression tutorial with more examples, details on the code and links to other key concepts and Python functions.
Note that beyond linear regression, data sets can also be analyzed to extrapolate a linear regression line in multi-dimensional space polynomial regression line in two or multi-dimensional space. For a complete presentation of linear regression, with mathematical formulas and extensions, check the Wikipedia page on Linear Regression.
To go further in each tutorial video, check the comments of the video on Youtube and the corresponding tutorial on the PythonProgramming website.
from statistics import mean
import numpy as np
import random
import matplotlib.pyplot as plt
from matplotlib import style
style.use('ggplot')


def create_dataset(hm,variance,step=2,correlation=False):
    val = 1
    ys = []
    for i in range(hm):
        y = val + random.randrange(-variance,variance)
        ys.append(y)
        if correlation and correlation == 'pos':
            val+=step
        elif correlation and correlation == 'neg':
            val-=step

    xs = [i for i in range(len(ys))]

    return np.array(xs, dtype=np.float64),np.array(ys,dtype=np.float64)

def best_fit_slope_and_intercept(xs,ys):
    m = (((mean(xs)*mean(ys)) - mean(xs*ys)) /
         ((mean(xs)*mean(xs)) - mean(xs*xs)))

    b = mean(ys) - m*mean(xs)

    return m, b


def coefficient_of_determination(ys_orig,ys_line):
    y_mean_line = [mean(ys_orig) for y in ys_orig]

    squared_error_regr = sum((ys_line - ys_orig) * (ys_line - ys_orig))
    squared_error_y_mean = sum((y_mean_line - ys_orig) * (y_mean_line - ys_orig))

    print(squared_error_regr)
    print(squared_error_y_mean)

    r_squared = 1 - (squared_error_regr/squared_error_y_mean)

    return r_squared


xs, ys = create_dataset(40,40,2,correlation='pos')
m, b = best_fit_slope_and_intercept(xs,ys)
regression_line = [(m*x)+b for x in xs]
r_squared = coefficient_of_determination(ys,regression_line)
print(r_squared)

plt.scatter(xs,ys,color='#003F72', label = 'data')
plt.plot(xs, regression_line, label = 'regression line')
plt.legend(loc=4)
plt.show()