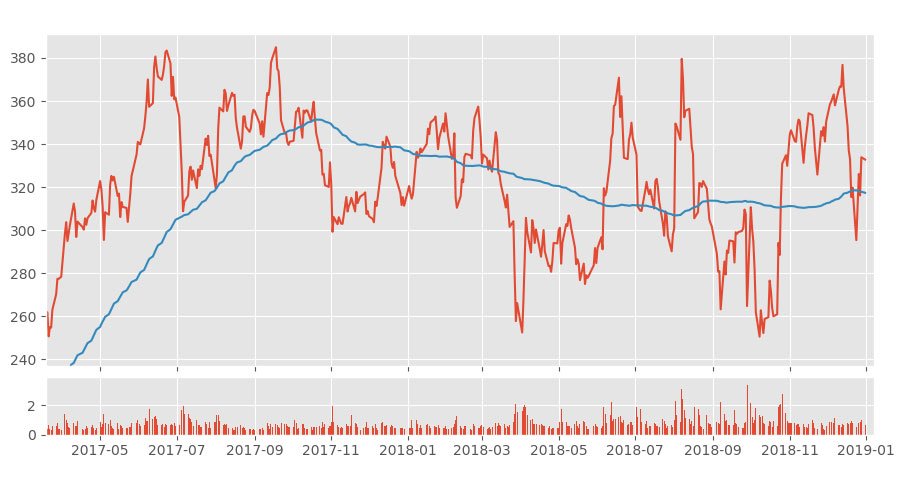
Diving deeper in data science and the actual coding of data processing functions and machine learning algorithms with Python, this series of tutorial gives us a great taste of what can be done in finance and stock trading. Through a hands-on approach, it guides us through the programming needed to retrieve, manipulate and visualize data, and, more importantly, to extract actionable insights.

This series of tutorials by Harrison Kinsley, also known as Sentdex and host of pythonprogramming.net, takes us step by step into programming for finance. Developed for programmers with a little experience in Python and machine learning, these tutorials show how to retrieve data from Yahoo Finance and perform various statistical and data science manipulations to obtain insights, with detailed explanations along the way.
Retrieving data, doing Data Science and Machine Learning for financial analysis and automated stock trading
With textual and video descriptions of each line of code, Sentdex presents great examples of how to use some of the most popular libraries in Python for data scraping and manipulation, visualization and machine learning, notably Numpy, Pandas, Pandas-Datareader, Beautiful Soup, Matplotlib and Scikit-Learn.
Notes and updates on Python Programming for Finance
The tutorials presented here can be found on his website with detailed videos and textual explanations, as well as on the Programming for Finance playlist of his YouTube channel. Since there wouldn’t be much value in just repeating what Sentdex already brilliantly did, only some updates, additional notes, and remarks are added hereafter.
These additional notes and updates cover parts 1 to 12, as the following parts 13 and on go more specifically in the details of how to use Quantopian and Zipline, which will be covered in an upcoming post.

Finance APIs
The tutorials make use of free daily stock quotations data of the S&P 500 companies obtained from the Yahoo Finance API. To adapt this tutorial to your needs, note that the API allows to obtain data from a number of stocks from other countries via their tickers, together with other data on various other financial assets, including currencies, cryptocurrencies, commodities, bonds, ETFs, etc.
To go further and obtain data from other sources, there are also many other free and paid APIs listed on Rapid API, including these popular finance APIs.
Updates to the code
Since these tutorials for Python 3.6 were written and recorded in early 2017, a few updates recently applied to the various libraries used do cause some minor issues and a few errors with the original code. Here are some alternate codes and updates to make sure all the functions work properly.
Matplotlib and candlesticks charts for stock prices
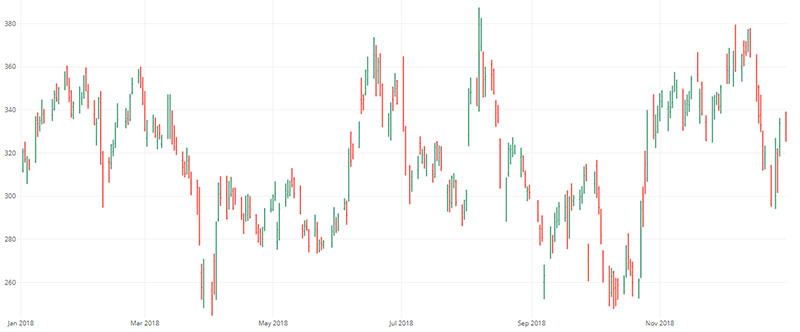
A few of the intial tutorials deal with data visualization with the Matplotlib library. However, Matplotlib has undergone major updates which deprecated its support for candlesticks charts, which are especially useful for the visualization of stock price charts.
In order to be able to successfully run the code presented in part 4, the Matplotlib Finance library must be installed manually via pip, then the import line:
from matplotlib.finance import candlestick_ohlc
must be replaced by
from mpl_finance import candlestick_ohlc
Another solution is to resort to another library that supports candlestick charts, like Plotly. First the library must be installed for offline charts, and the following code can then successfully be run, resulting in a beautiful candlestick graph that is run in as an HTML file in a web navigator.

Data freshness and correlation of stock prices over time
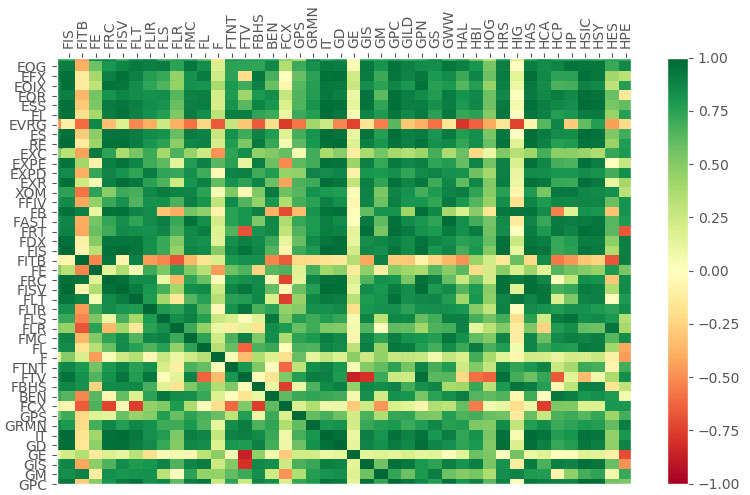
In part 9. of his tutorial series, Harrison Kinsley gives us an important remark / warning of the data available and correlation of companies:
“You probably shouldn’t do it [correlations analysis] for such long period as the relations between companies may have evolved significantly over time. You would need to do it over a shorter period (1-2 years), but you would need more data with intra-day evolutions. We have only daily data because it’s free.”
Some other datasets, APIs or libraries may allow for the recovery of intra-day evolutions of stock prices, but they would require to be bought and more computing power to process…
Scikit-Learn and Machine Learning
The last tutorials of this sub-series (part 9 to 12) requires a few modifications to allow for an easier editing of the time frame to be managed through the hm_days variable with list-comprehension.
Furthermore, the key library Scikit-Learn for Machine Learning has also been updated since 2017. It now requires different import and calls for the cross_validation function to train and tests the ML algorithms. So hereafter is the updated code including these two updates.
