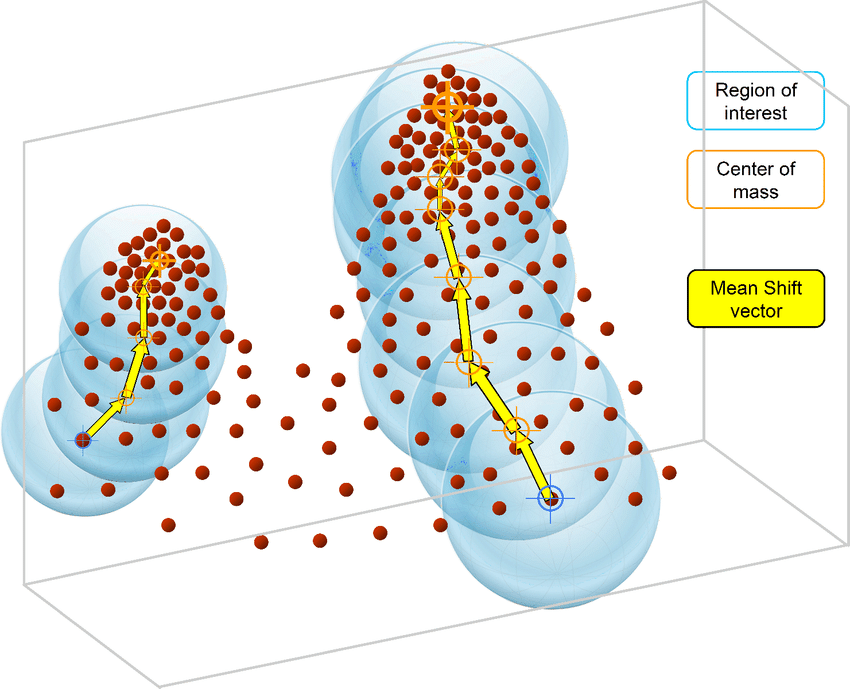
Mean Shift is an unsupervised machine learning algorithm. It is a hierarchical data clustering algorithm that finds the number of clusters a feature space should be divided into, as well as the location of the clusters and their centers. It works by grouping data points according to a “bandwidth”, a distance around data points, and converging the clusters’ centers towards the densest regions of data.

To go into the details of Mean Shift and to program it in Python, this complete series of tutorials by Harrison Kinsley, a.k.a. Sentdex, dives in all the details of the Mean Shift clustering algorithm, programming tricks and present example uses.
The final code can also be obtained from Sentdex Python Programming website, in the corresponding Mean Shift tutorial with more examples, a comparison with the “Titanic dataset”, details on the code and links to other key concepts and Python functions.
The following videos regroup the Mean Shift tutorials from the Machine Learning with Python series (parts 39 to 42) by Sentdex on Youtube.
For a complete presentation of this clustering algorithm, with mathematical formulas and extra developments, check the Wikipedia page on the Mean Shift clustering algorithm.
import matplotlib.pyplot as plt
from matplotlib import style
import numpy as np
from sklearn.datasets.samples_generator import make_blobs

style.use('ggplot')

X, y = make_blobs(n_samples=15, centers=3, n_features=2)
##X = np.array([[1, 2],
##              [1.5, 1.8],
##              [5, 8],
##              [8, 8],
##              [1, 0.6],
##              [9, 11],
##              [8, 2],
##              [10, 2],
##              [9, 3]])


##plt.scatter(X[:, 0],X[:, 1], marker = "x", s=150, linewidths = 5, zorder = 10)
##plt.show()

'''
1. Start at every datapoint as a cluster center

2. take mean of radius around cluster, setting that as new cluster center

3. Repeat #2 until convergence.

'''


class Mean_Shift:
    def __init__(self, radius = None, radius_norm_step = 100):
        self.radius = radius
        self.radius_norm_step = radius_norm_step

    def fit(self,data):

        if self.radius == None:
            all_data_centroid = np.average(data,axis=0)
            all_data_norm = np.linalg.norm(all_data_centroid)
            self.radius = all_data_norm/self.radius_norm_step
            print(self.radius)

        centroids = {}

        for i in range(len(data)):
            centroids[i] = data[i]

        weights = [i for i in range(self.radius_norm_step)][::-1]
        while True:
            new_centroids = []
            for i in centroids:
                in_bandwidth = []
                centroid = centroids[i]

                for featureset in data:

                    distance = np.linalg.norm(featureset-centroid)
                    if distance == 0:
                        distance = 0.00000000001
                    weight_index = int(distance/self.radius)
                    if weight_index > self.radius_norm_step-1:
                        weight_index = self.radius_norm_step-1

                    to_add = (weights[weight_index]**2)*[featureset]
                    in_bandwidth +=to_add

                new_centroid = np.average(in_bandwidth,axis=0)
                new_centroids.append(tuple(new_centroid))

            uniques = sorted(list(set(new_centroids)))

            to_pop = []

            for i in uniques:
                for ii in [i for i in uniques]:
                    if i == ii:
                        pass
                    elif np.linalg.norm(np.array(i)-np.array(ii)) <= self.radius:
                        #print(np.array(i), np.array(ii))
                        to_pop.append(ii)
                        break

            for i in to_pop:
                try:
                    uniques.remove(i)
                except:
                    pass

            prev_centroids = dict(centroids)
            centroids = {}
            for i in range(len(uniques)):
                centroids[i] = np.array(uniques[i])

            optimized = True

            for i in centroids:
                if not np.array_equal(centroids[i], prev_centroids[i]):
                    optimized = False

            if optimized:
                break

        self.centroids = centroids
        self.classifications = {}

        for i in range(len(self.centroids)):
            self.classifications[i] = []

        for featureset in data:
            #compare distance to either centroid
            distances = [np.linalg.norm(featureset-self.centroids[centroid]) for centroid in self.centroids]
            #print(distances)
            classification = (distances.index(min(distances)))

            # featureset that belongs to that cluster
            self.classifications[classification].append(featureset)


    def predict(self,data):
        #compare distance to either centroid
        distances = [np.linalg.norm(data-self.centroids[centroid]) for centroid in self.centroids]
        classification = (distances.index(min(distances)))
        return classification


clf = Mean_Shift()
clf.fit(X)

centroids = clf.centroids
print(centroids)

colors = 10*['r','g','b','c','k','y']

for classification in clf.classifications:
    color = colors[classification]
    for featureset in clf.classifications[classification]:
        plt.scatter(featureset[0],featureset[1], marker = "x", color=color, s=150, linewidths = 5, zorder = 10)

for c in centroids:
    plt.scatter(centroids[c][0],centroids[c][1], color='k', marker = "*", s=150, linewidths = 5)

plt.show()
Illustration: original image from ResearchGate
